COVID-19 Vaccine Distribution Model
Imagine, it’s December 2020. There are long winded queues in
front of the pharmacies and vaccine distribution centres. The
Australian government only has a very limited number of
vaccines. The population is desperate to return to normality and
the vaccine is the only key to achieving this. For the
government to reach the minimum requirement herd immunity needs
to be reached. With a population of 25 million and barely 15
million vaccines. How will the government succeed in effectively
distributing the vaccines?
Fortunately, a small team called the Hacker-Knights come to the
rescue.
A novel way of achieving herd immunity and a simple prediction
tool with intuitive visualisation filters, that will assist the
government in taking control of COVID-19 in the most efficient
manner.
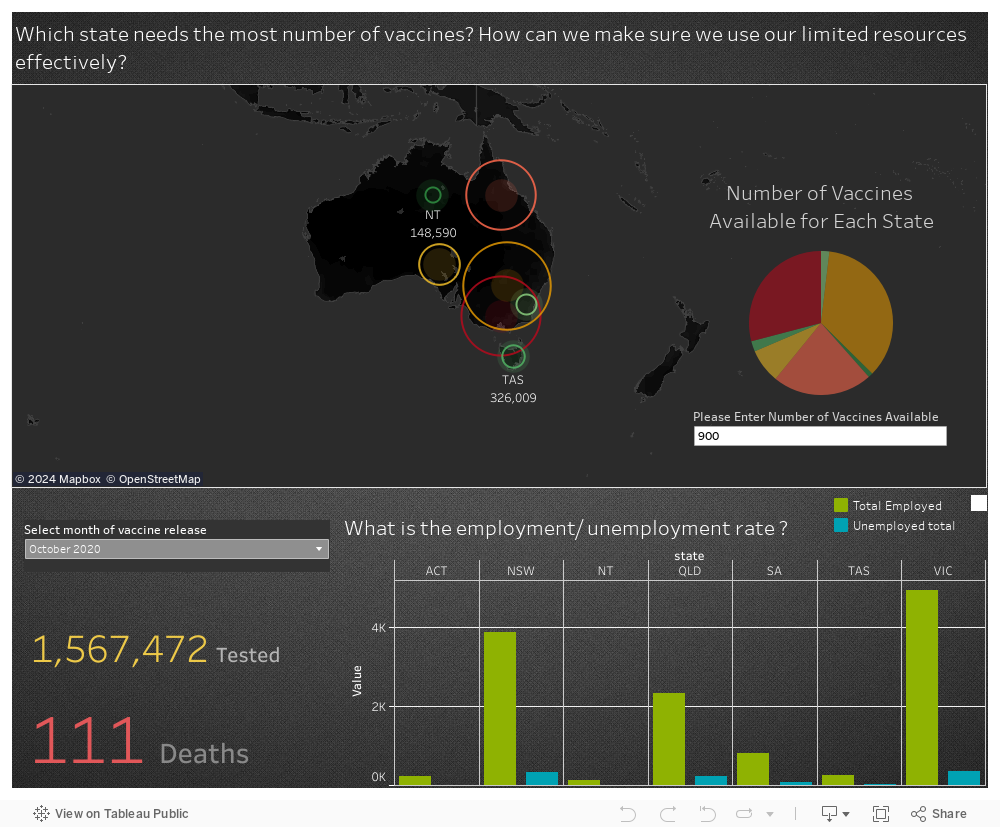
The idea is to achieve below outcomes with the government data:
- Forecast for the covid impact for future months with the existing covid factors (e.g: cases on daily basis, confirm, recovered, deaths and infection rate etc.)
- Predict the minimum number of vaccines required to achieve herd immunity of a particular region. We considered R-nought, a variable factor, as 2.2 (average according to available sources) hypothetically for the limitation of data and time constraint.
- Find out the optimal way of distributing available vaccines to the most affected regions based on multiple factors like business impacts, available distributed channels, social, economic conditions and also to achieve herd immunity across the region as fast as possible.
Data Story
The datasets used come from various sources including Australian
Bureau of Statistics, Github open source data and Australia
Population (2020) Worldometer. One of the major challenges has
been to extract precisely the most relevant data by combining
different unstructured datasets into a single effective
aggregated dataset that has been normalised. Having the monthly
statewise covid cases, deaths and population we extrapolated the
number of vaccines needed for each region and improved the
prediction efficiency using factors such as employment and
unemployment. An interactive visualisation web dashboard(shown
in the video) has been built for users.
This model takes into consideration covid cases that have been
confirmed and deaths per state over a time period to calculate
the R naught value. These cases have been forecasted upto march
21 using multiple linear regression.
After calculating R naught found to be 2.5 on average. We
calculated the number of vaccines needed to reach herd immunity
for each state according to its population. Formula for Herd
immunity: 1/(1-Rnaught) We have run this algorithm to our
forecasted range of Mar 21.
If we get limited number of vaccines, the algorithm calculates
the optimal distribution of vaccines to take smaller steps
towards herd immunity (no more a pandemic).
Future implementation could use more features(density, social
distance, house rents, food habits) to train a Neural Network
model for the weighted and variability factor to achieve the
real time R-naught more accurately to eradicate COVID-19.
Team
Knights who served for the hack

Nazmul

Naga

Mahesh

Afrida

Quang

Jan
Team DataSets
Datasets that were used
Frequently Asked Questions
For NSW the map displays 4,934,944 vaccines are needed, but how to achieve herd immunity, when we have 4 million vaccines only for the whole of Australia now?
According to the map NSW would be able to achieve herd immunity over cumulative months initially requiring 1,421,249 vaccines(See label with “number of vaccines available”). This helps the Government to rapidly detect the area to respond in an emergency.
We’d like to implement the tool outside of Australia. Whom to contact?
Hackerknights would be extremely happy to assist you. Please contact Nazmul (team leader) through LinkedIn for any questions regarding or expanding the project.
How accurate is Covidvaccineready’s prediction?
Currently its as accurate as any machine learning forecast but the accuracy can be strictly measured once we have the real number of covid cases until March 2021.